Creating a Metric
Overview
Once you have defined your Features and Events within Causal, you can build Metrics. Every experiment uses the Metrics to measure the impact of your treatment vs. control.
Causal supports two types of Metrics:
- A mean (x-bar): The average value for all observations in the sample. When the specified event attribute is a continuous value (e.g. Revenue) we support finding the average max, min (for that specific impression/session) or average sum of the value.
- A proportion (p-hat): The proportion of observations in the sample that match (or don’t match) the specified criteria.
When building a metric, first you’ll choose how you want to group the metric. Are you interested in this metric grouped by impression, user session, or a custom value (any of the session fields marked with @per in your FDL).
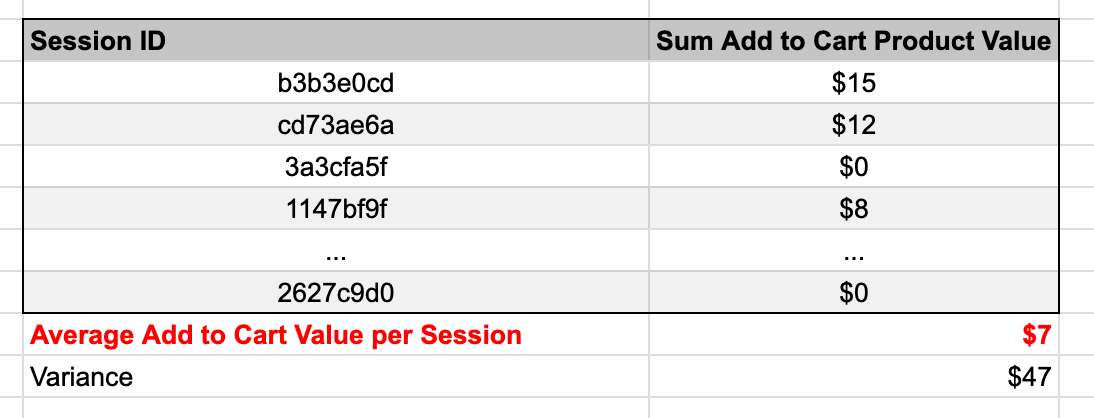
Next, you’ll choose the items you want to count for the metric. This could be any feature impression, a specific event on the feature occuring, or a specific event attribute (e.g. checkout revenue). For example, if you wanted to know the average value of products added to the cart from the Product detail page, you would calculate the average sum of the Product Detail > Add to Cart > Product Value. If you chose session as your grouping in the first step
We are building a table containing each relevant session (or impression or other group), the aggregate value for that session and then calculating the average and variance for those metrics across all the group members. These metric tables are synced to your data warehouse for further analysis.
Metric Aggregation Types
Means
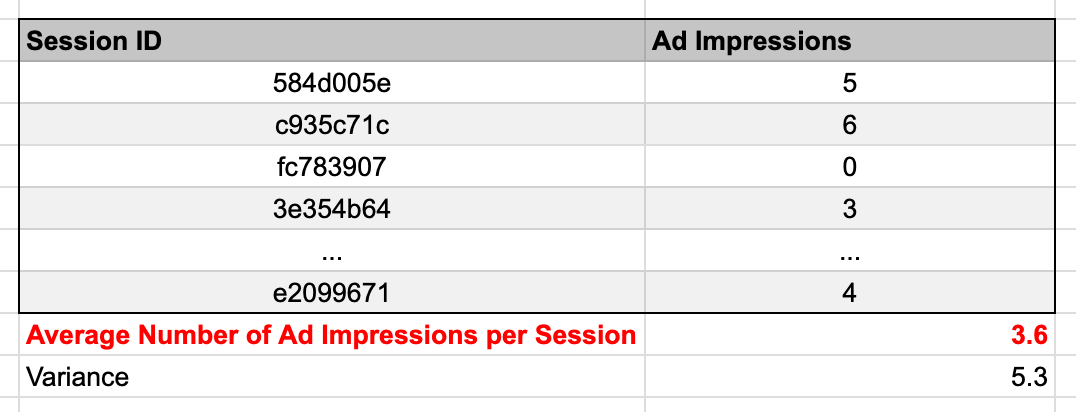
Count of
A “count of” metric allows you to measure how often individual events happen on a per group basis. For example, you might be interested in the average number of ads a user is exposed to on a per session basis. You would select the event of interest (Ad Impression), and select the Count of aggregation type.
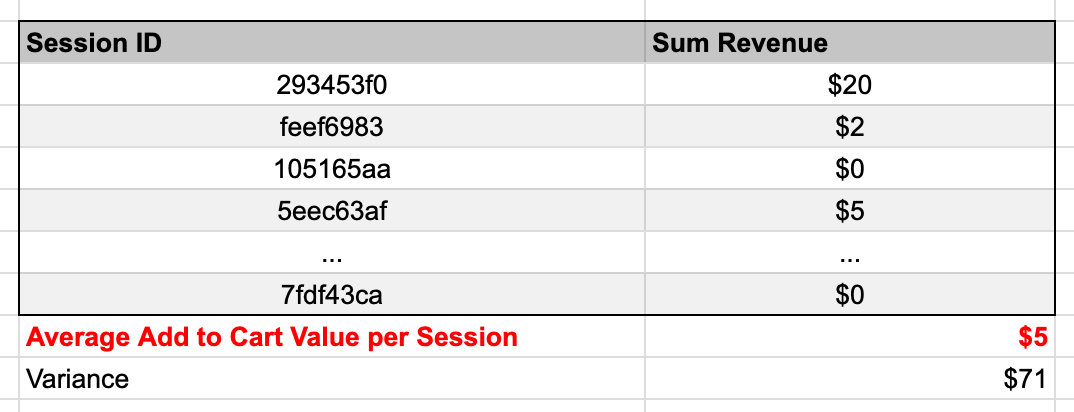
Sum
A sum metric allows you to measure the average total value for an event value on a per group basis. For example, you might want to know the average total revenue per session. You would select the Revenue attribute on the feature event and select sum.
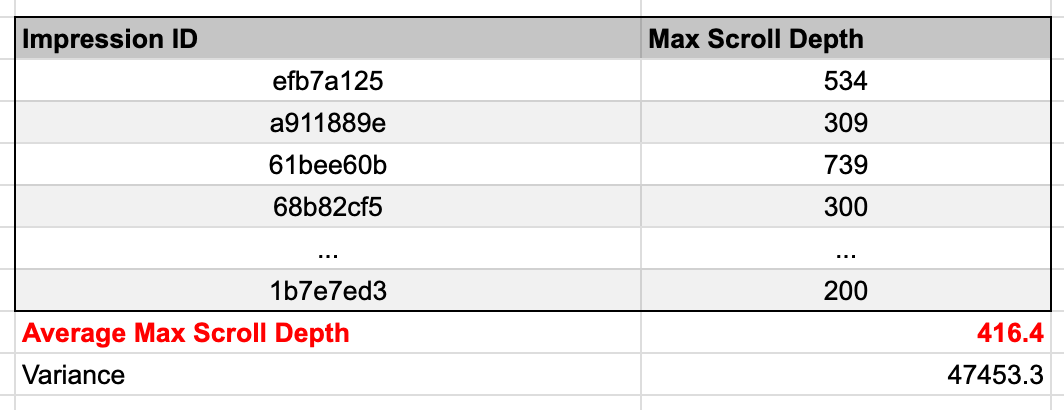
Max / Min
A max metric allows you to measure the average max (or min) value for an event. For example, you may wish to know how “deep” someone scrolled on an infinite scroll list page. If your team fired a “scroll event” with a depth value, selecting max would give you the max value for each impression (or session), and then average that across all impressions to calculate the average max scroll depth.
Proportions
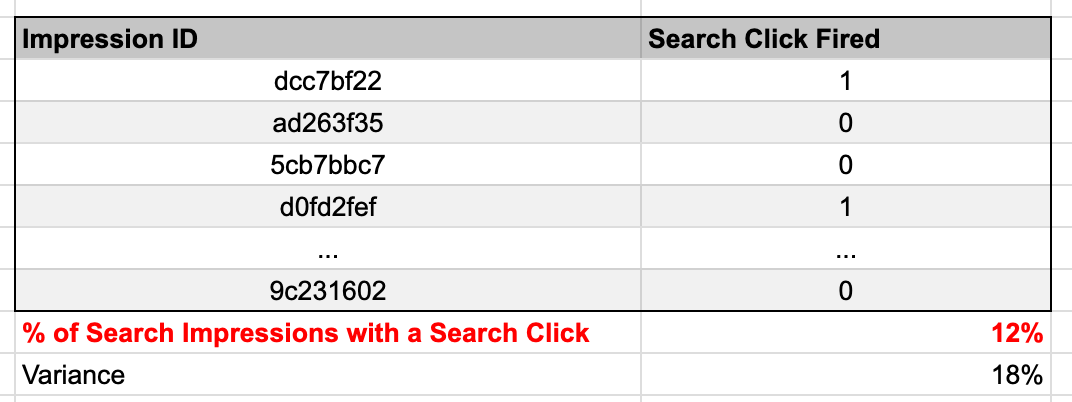
Proportion of
A proportion measures the number of group members out of the total group that triggered the event. For each group member, we only count the first event. If a specific impression fires an event 5 times, we’ll only count the first one for the purposes of calculating the proportion.
Proportion without
Inverse of a proportion of metrics: 1 - the proportion of value. This would be useful for bounce rate style metrics, where you want to focus on the % of users that do not engage with a feature.
Filtering Metrics
Additionally, we allow users to filter an event to only measure a specific subset of events. You can filter the event based on either session properties for the user, or other properties on the measured event. For example, if your sessions are tagged with a bot classification, you could filter ad clicks on an ad unit to remove suspected bots.